


Lumentum stock price has gone vertical this year and is now trading at its all-time high.
LITE jumped to a high of $803, up by 1,600% from its lowest level in December.
This rally may be about to end as it approaches the distribution phase of the Wyckoff Theory.
Wyckoff Theory suggests that the Lumentum stock price may retreat soon
The weekly timeframe chart explains why the Lumentum stock price has jumped in the past few months.
This chart shows that the stock remained inside a narrow range between the support and resistance levels at $37 and $105 between December 2018 and July last year.
Attempts to move above the upper side found substantial resistance several times. Also, it failed to move below the lower side.
Therefore, this price action is a sign that the stock was inside the accumulation phase of the Wyckoff Theory, which is characterised by sideways price action.
The accumulation phase is then followed by the markup phase, which is characterised by high demand and the Fear of Missing Out (FOMO).
In most cases, the markup phase is usually triggered by a major event, which, in this case, was a $2 billion investment made by NVIDIA in the company.
The MACD and the Relative Strength Index (RSI) have continued rising this year.
Also, the RSI had moved to the extreme overbought level, while the two lines of the MACD have moved to the highest level in years.
As such, the stock may be nearing the distribution and the markdown phase, which are characterised by steep declines as investors book profits.
If this happens, the Lumentum stock may drop to the 38.2% Fibonacci Retracement level at $515, which is about 35% below the current level.
A drop below that level will point to more downside, potentially to the 50% retracement level at $425, down by 47% from the current level.
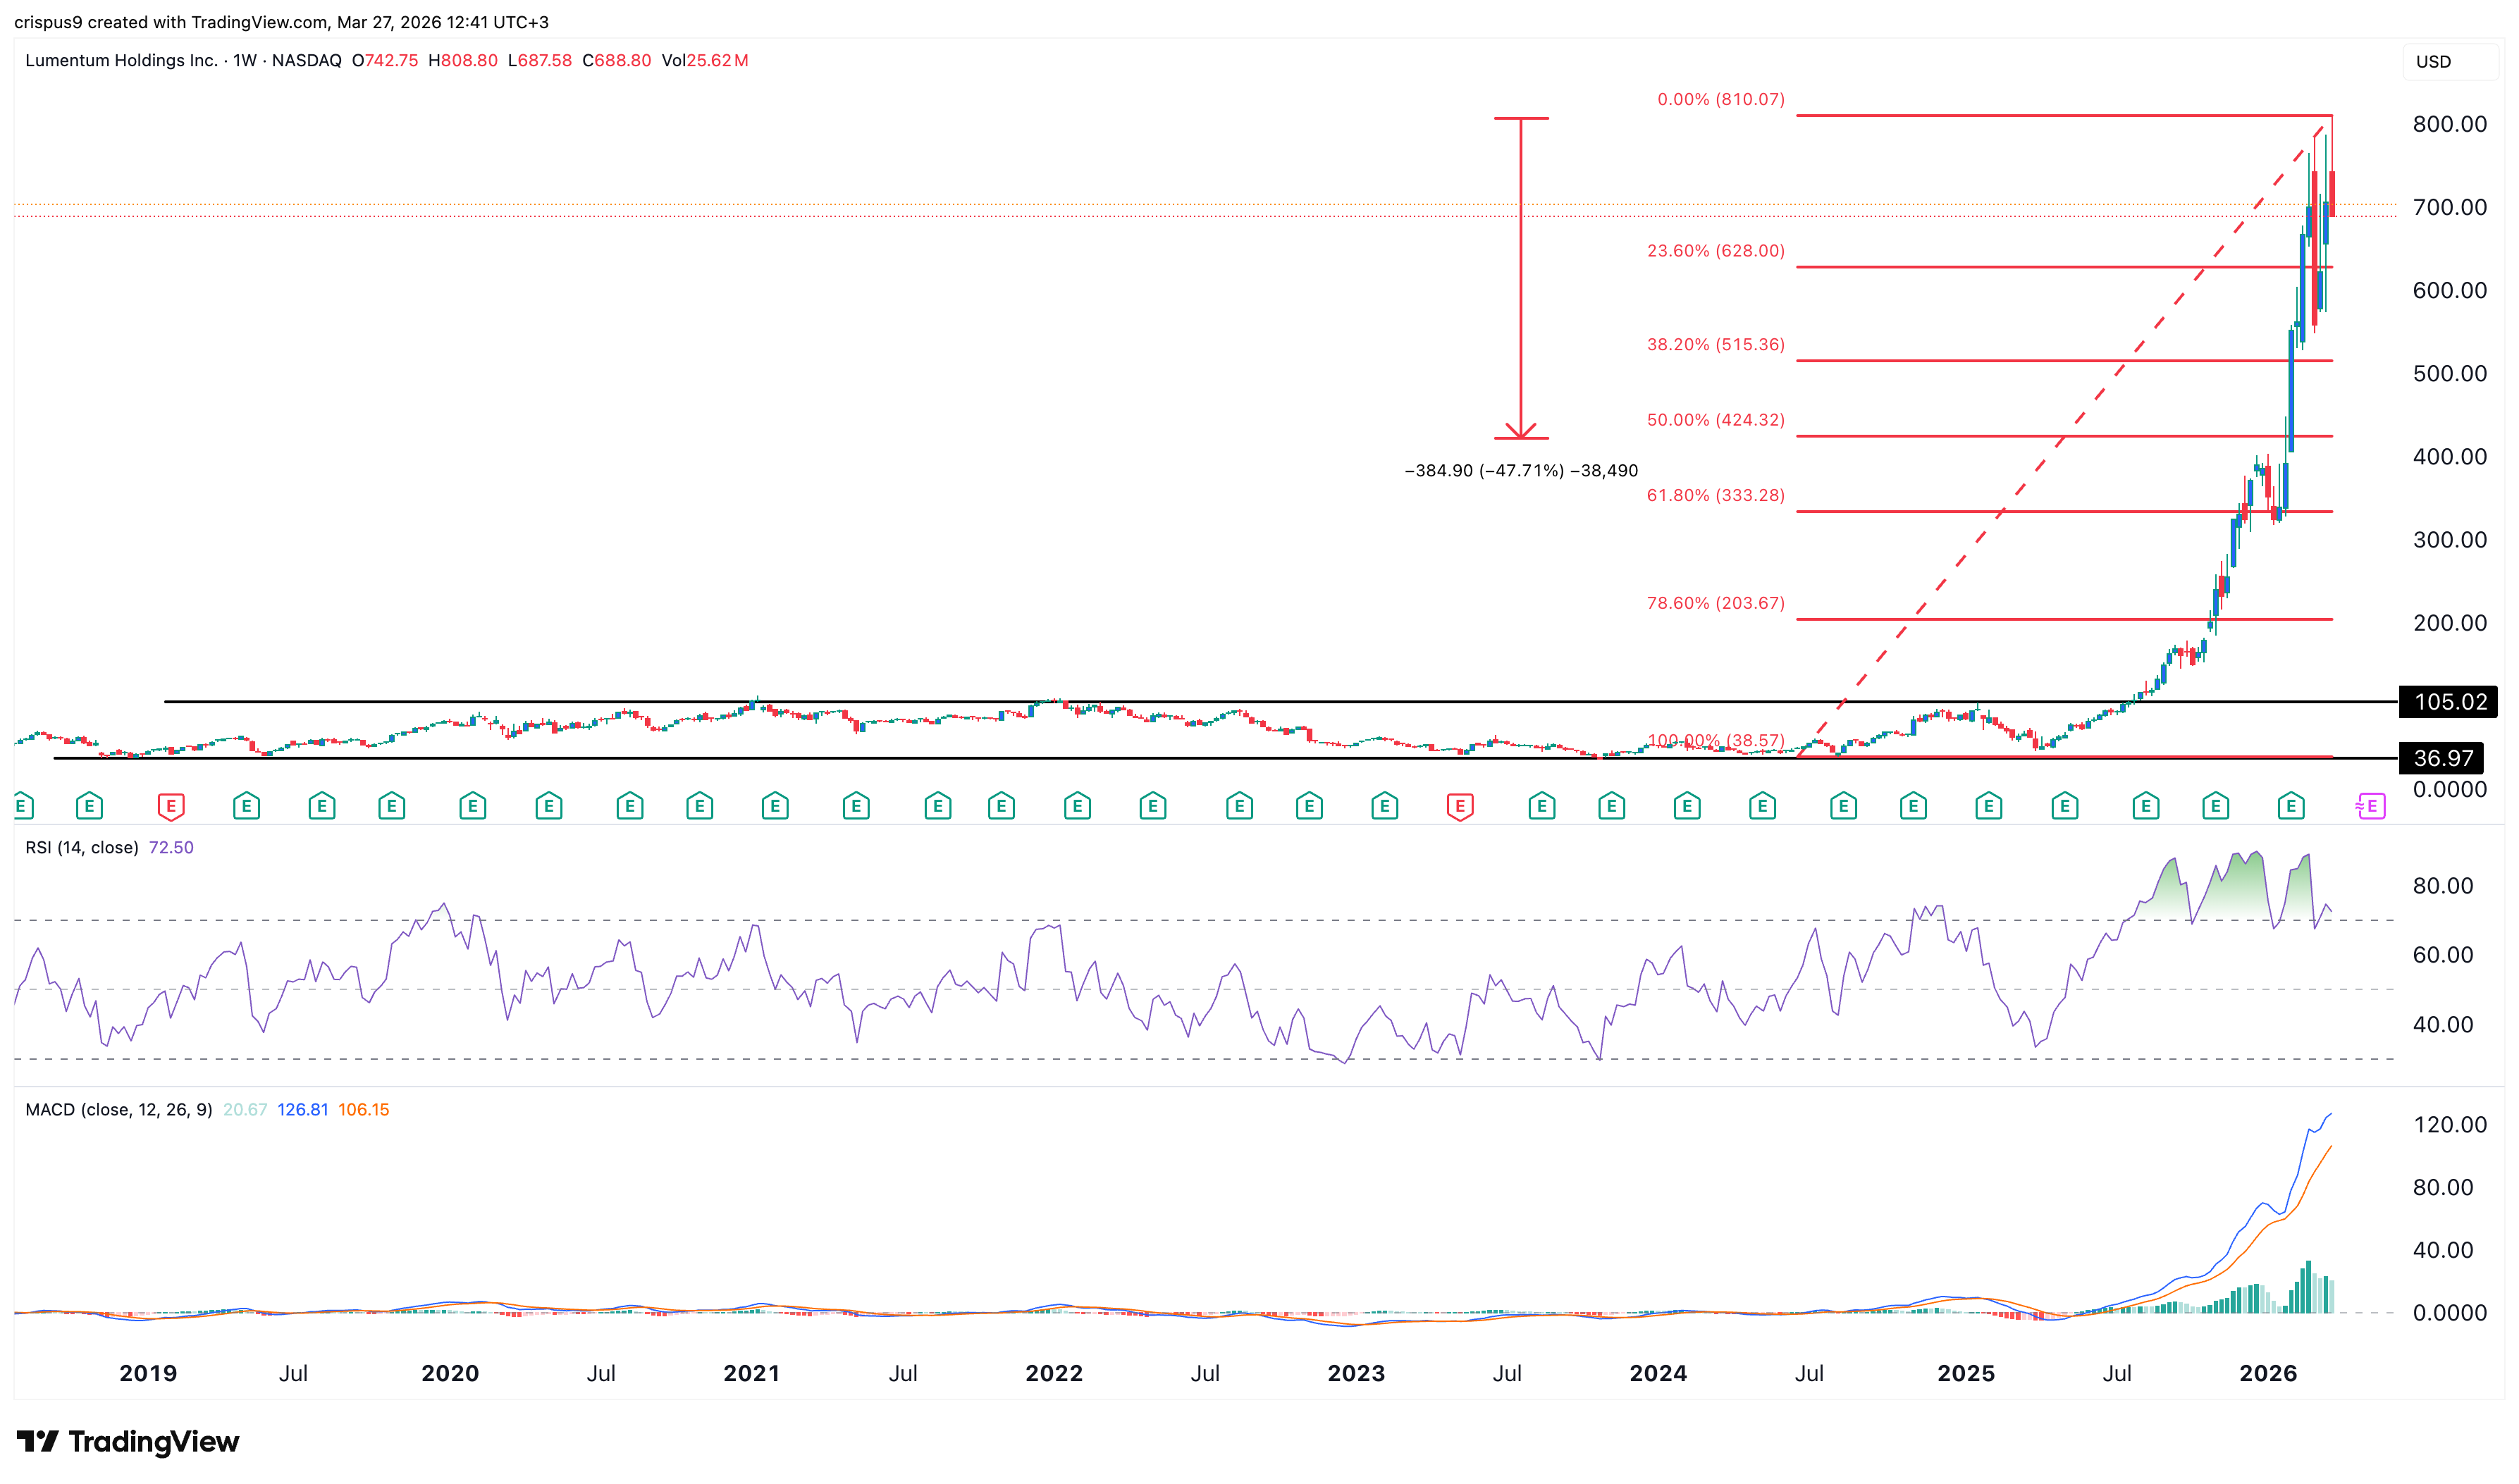
Lumentum stock chart | Source: TradingView
A good example of the Wyckoff Theory in action is shown in the weekly chart of the Zcash price, which is shown below.
This chart shows that the token remained in a tight range between June 2022 and September last year.
It then went parabolic and reached a record high of $745 in November last year.
It did that as it moved to the markup phase, as demand from investors rose.
It then moved to the markdown phase, to the current $220, which is about 70% below the highest point last year.
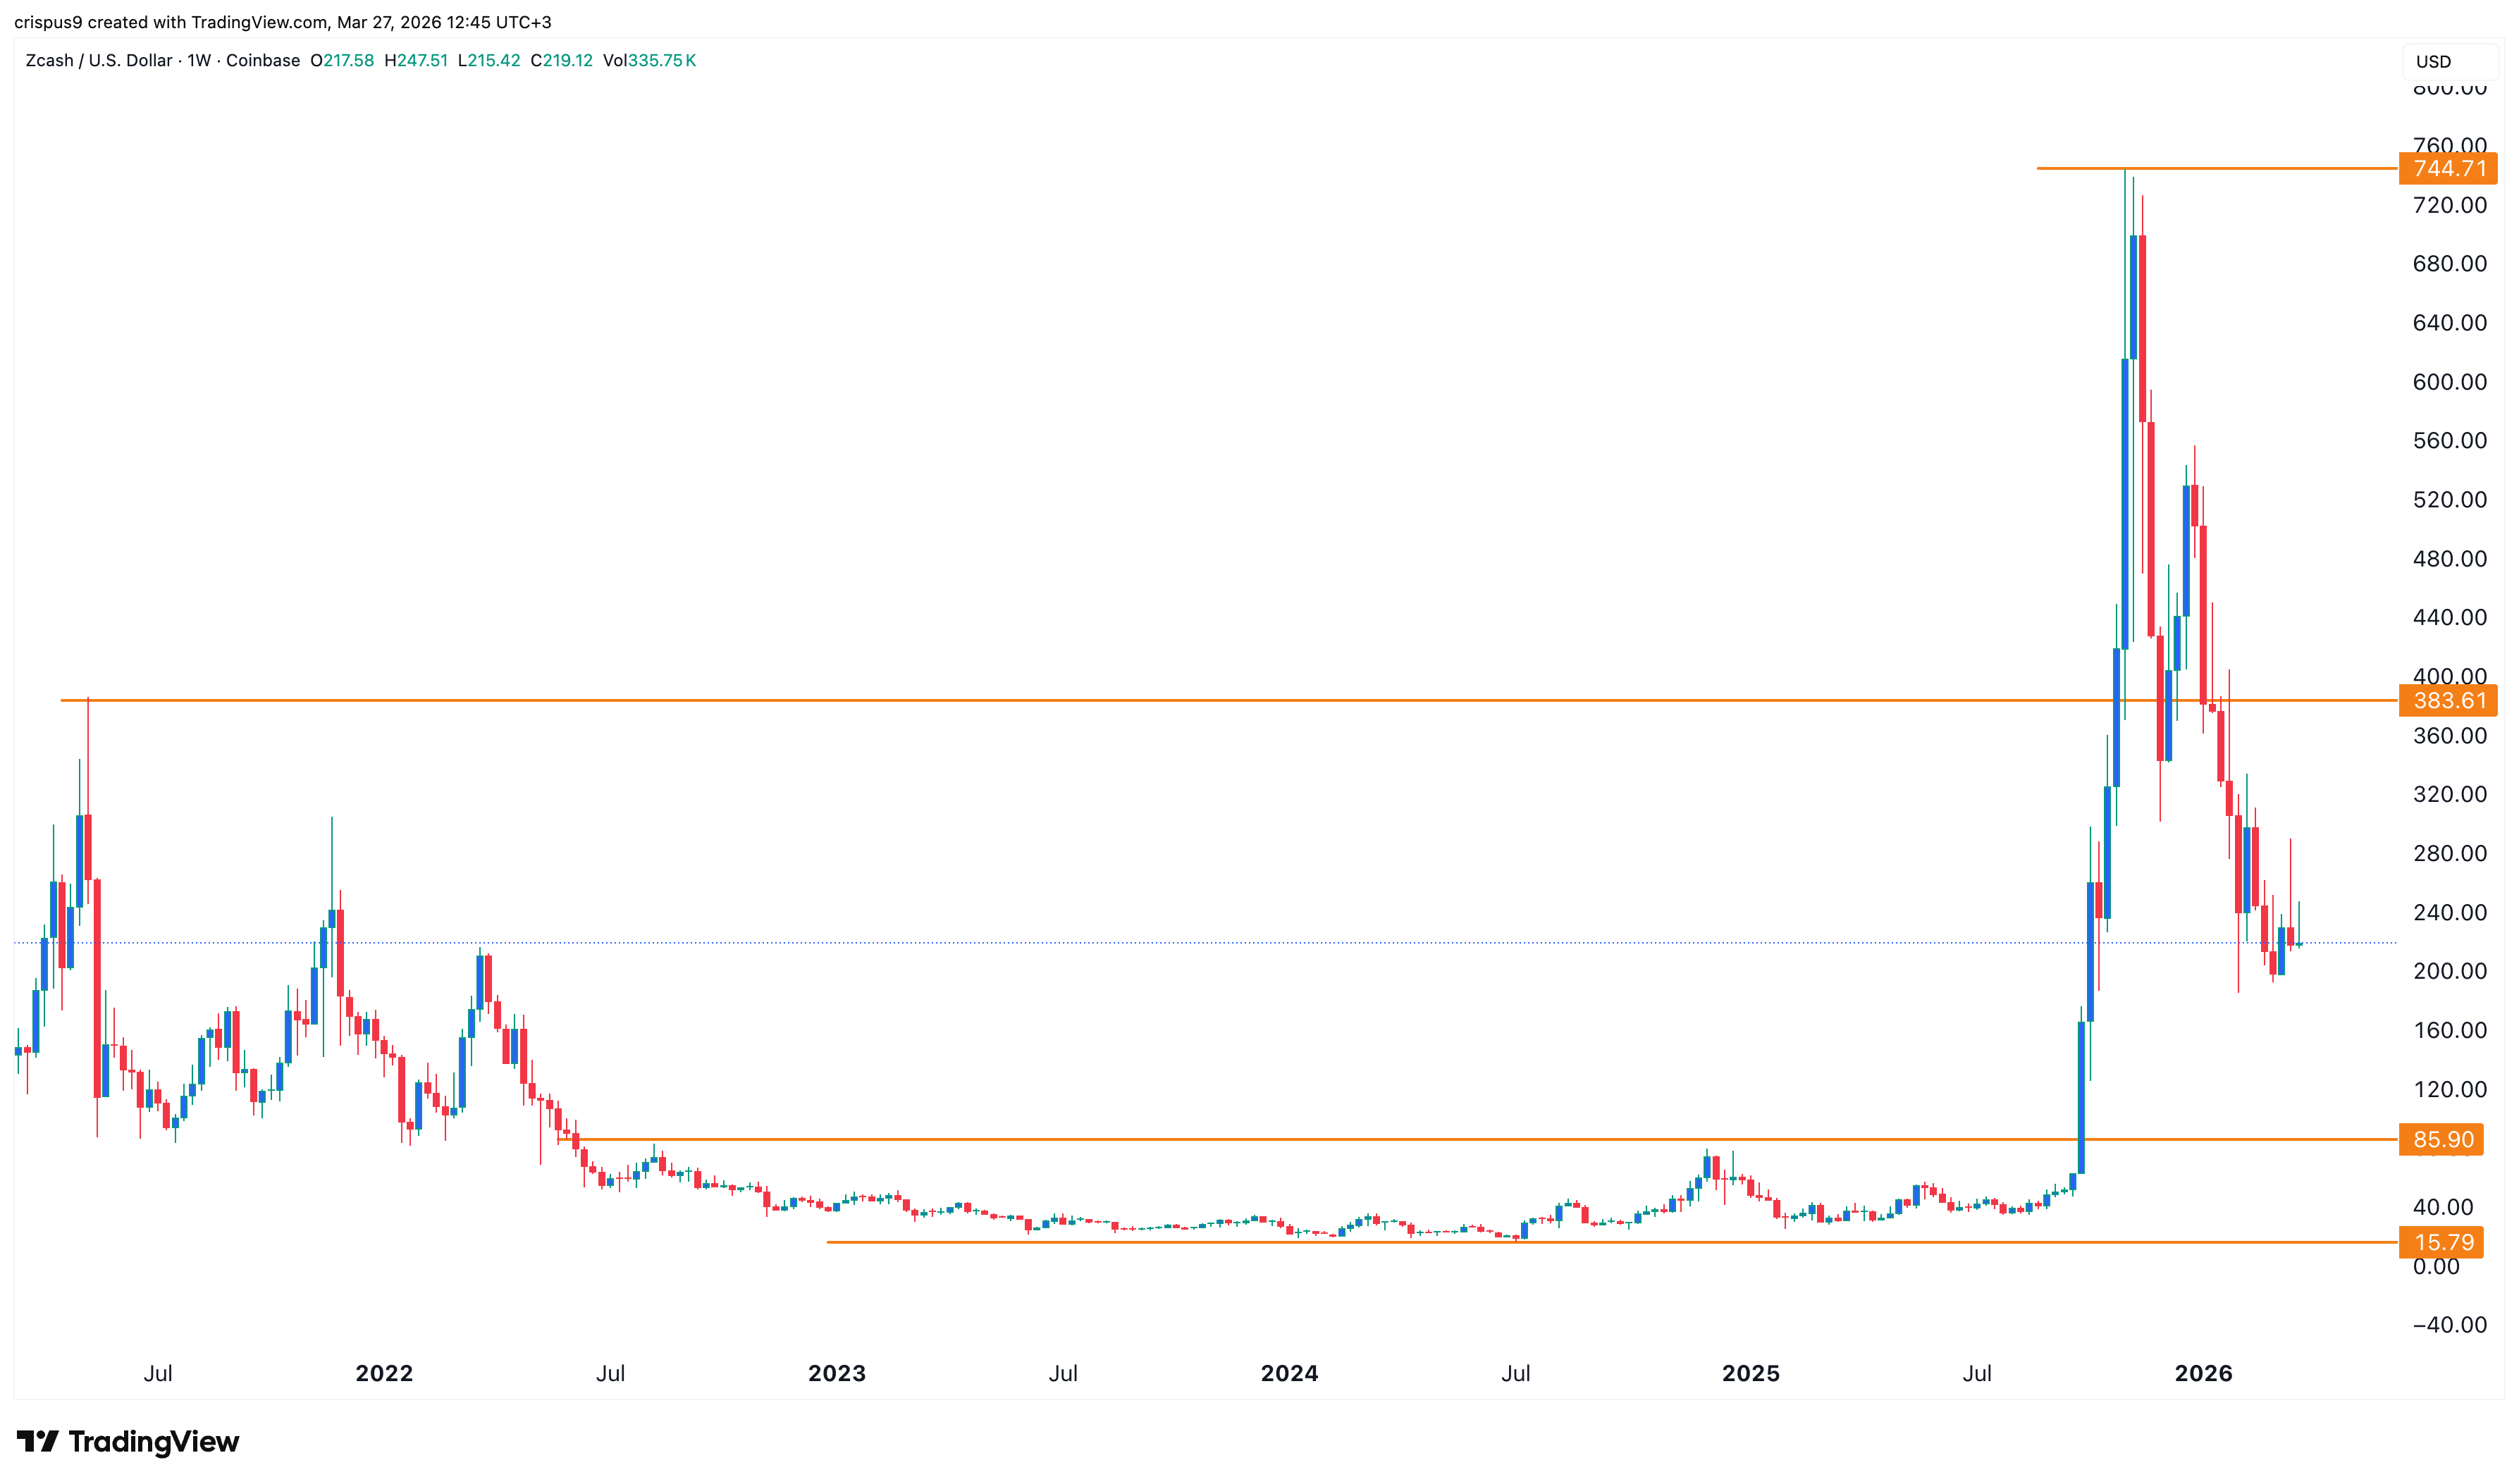
Zcash price chart | Source: TradingView
Lumentum’s valuation has jumped recently
Third-party data shows that Lumentum stock has become highly overvalued.
According to Seeking Alpha, the company has a forward price-to-earnings ratio of 101, much higher than the sector median of 21.
Based on the GAAP metrics, the company has a forward multiple of 174.
These numbers are huge considering that the S&P 500 Index has a multiple of 23.
Also, the valuation is much higher than other large technology companies, including NVIDIA and Micron, which have multiples of less than 25.
On the positive side, Lumentum has a strong growth momentum as demand for its products rises amid the ongoing AI boom.
The most recent numbers showed that the company’s revenue rose by 65% in the last quarter, helped by the components division, which made over $443 million and its systems segment, which made $221 million.
Analysts expect that the revenue growth will continue in the coming years.
The average estimate is that its revenue growth will be 76% this year to $2.91 billion, and 65% next year to $4.8 billion.
If this trend continues, the company’s revenue will likely hit $10 billion in the coming years.
The post Lumentum stock: Wyckoff Theory points to a steep crash soon appeared first on Invezz